Guest post from Jason Boczar, Digital Scholarship and Publishing Librarian, USF Libraries, Tampa campus.
Well-formed data is a luxury. When working with large datasets, researchers must engage in clean-up that includes fixing spelling mistakes or creating consistent numbering patterns. Without these changes, analysis can suffer from errors, threatening the results of a study. While it is possible to clean messy data with Microsoft Excel, Open Refine may be a better tool for the job.
As the Digital Scholarship and Publishing Librarian at USF Libraries, I am constantly sifting through data and adding data sets to USF Libraries’ institutional repository, Digital Commons. Since discovering Open Refine, I’ve been able to find errors in data, create reproducible steps to repeat my progress, and process data into the format I need. In this post, I will introduce you to this fantastic tool and provide you with a few examples of how you can apply it to your own data sets.
OVERVIEW
Open Refine is open-source software designed to help clean messy data. Open Refine’s features let you facet and drill down through datasets and batch edit values and cells. It works offline, keeping your data safe and private.
IMPORTING DATA
Open Refine can accept imports from many popular file-types such as TSV, CSV, *SV, Excel (.xls and .xlsx), JSON, XML, RDF as XML, and Google Data documents.
Below is the beginning layout for creating a new Open Refine project. Notice the different options available, such as importing from a URL or inputting the data from your Clipboard.

Once the data is imported into Open Refine the researcher is presented with a familiar spreadsheet style layout with sortable columns for each data field.

MENU OPTIONS
However, the rows and columns function differently than in Excel or similar programs. Each column has a menu with different options to manipulate the contents of the column and rows. Clicking on the arrow at the top of the column will open the menu, providing many of the helpful features of Open Refine.

TEXT FACET OPTION
One helpful feature when using these menus is the Text facet option. Facets allow you to find “aspects or angles of data variance in a given column”1 which can help you see the bigger picture. This is similar to using a filter for columns in Microsoft Excel but with extra functionality like easily changing the name for all matching items or narrowing the results by the count of choices.

By selecting this option for a column, the user will get a list on the left that has every unique entry in the column. From there. they can select an entry. Every item in the column now matches the facet.

CLUSTER FUNCTION
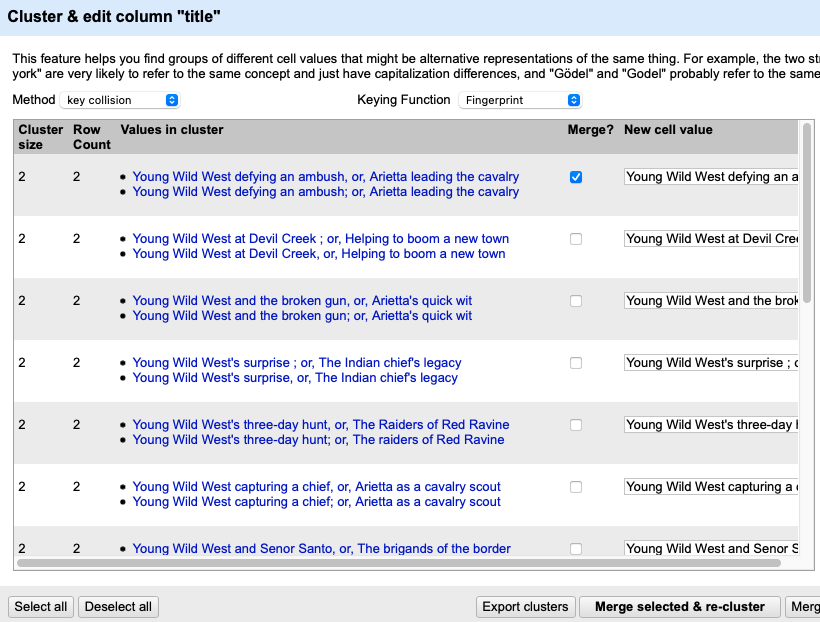
Another example of the power of Open Refine is the “Cluster” function. As seen in the previous image, there is a button titled “Cluster” in the Facet/Filter box. This is a powerful AI tool that will look through all the items in the column and find similar entries. The tool allows the user to quickly go through the identified entries and select if they should be merged into one. Then, the user will select any of the identified entries as the new name. See below for the Cluster function used on the Title column. In the first entry that one item uses a comma while the other uses a semi-colon. Clicking on the Merge checkbox will combine them. Clicking on either of the titles will use that as the new title for both entries.

FINAL THOUGHTS
This overview only touched the surface of what Open Refine can do to provide examples of how to apply it to your own data sets. You can find more information on their website, https://openrefine.org. Their extensive documentation will help you find many of the advanced features.